
Making the cut - Explaining lay-offs with data
Making sense of lay-offs amidst the media noise. Doing some number crunching to answer key questions - Who's getting laid off? Which functions? Seniority levels? Who's at risk? Why? Dive in.

The past few months have been bursting with loud headlines about layoffs in big tech. Only at the beginning of 2023, there were 536 publications related to cuts. For instance, Amazon has announced cuts 4 times, Microsoft 3 times, and Meta 2 times. Amidst this turmoil, it’s tempting to jump to generalizations and start questioning your own job security.
But let’s separate the wheat from the chaff and look at the phenomenon not from the perspective of clickbait titles, but from the lens of actual data. How many people are being laid off? Who’s making the cuts? Which functions? Why? How does the current tech downsizing compare to the 2008 crisis or the dot com crash of 2003?
By breaking this mess of noise into digestible chunks, we can try to make sense of what’s really going on and understand what we can learn from it. Let’s dive in.

How big are the cuts?
Layoffs began gradually in Jan 2022 (with 510 being cut) and reached their peak in Jan 2023 (84,714 employees).


Over the course of the whole of 2022 - 161,411 people were laid off while just in the three months of 2023 this number has skyrocketed to 153,873. The trend has been gradually increasing and peaked in Jan’23. A simple sliding average forecast shows that it’s likely the cuts are going to slightly increase throughout 2023, but peaks are difficult to predict as they will depend on economic realities.
Who’s making the cuts?
1588 companies have announced downsizing in 2022-2023. Geographically they are dispersed all across the world with the biggest chunk (65%) coming from the US. Amidst the long tail of other countries, the biggest share is represented by India with 6% of the cuts.
Which sectors
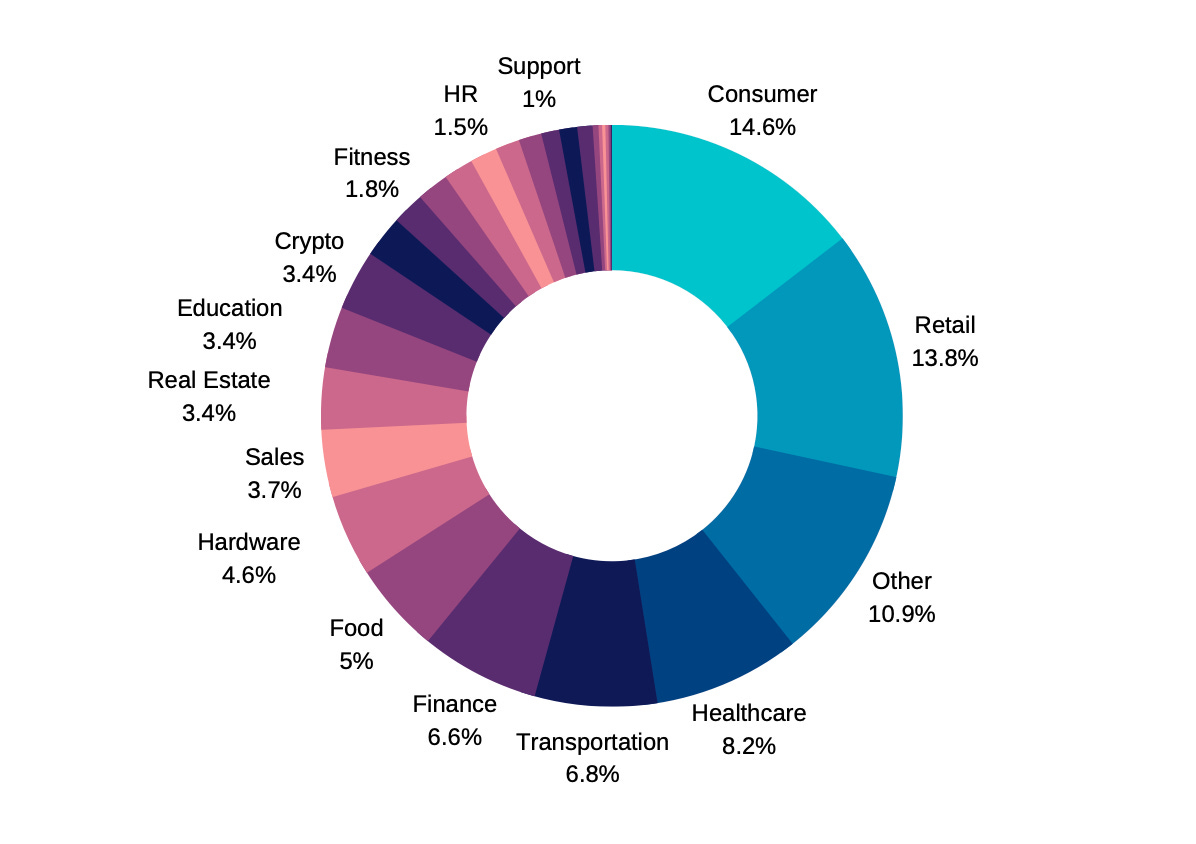
The leading segment is Consumer products (14.6% or 46.4K jobs), which includes Meta/Google/Quora and a long tail of other consumer tech companies.
Second place in the chart is Retail (13.8% or 44.0K) with companies like Amazon/Lyst/Wayfair and others.
Third leading Healthcare (8.2% or 25.9K) with biggest cuts down by companies like Phillips (4K jobs), Invitae (1K jobs), and GoHealth (0.8K jobs)
There’s also a segment named “Other” (a compilation of companies from various sectors), representing 10.9% or 34.0K jobs cut - a larger chunk of those numbers is driven by companies like Microsoft (10K jobs), Ericsson (3.8K) and SAP (3.0K).
Share of the downsizing
Absolute numbers of cuts by themselves might be misleading, hence, let’s look at them from the perspective. How big are those lay-offs in relation to the company size?

Top 12 companies (in terms of the size cuts), representing 4% of all the market cuts in 2022-2023 - were ranked in the descending order of the absolute layoffs numbers (Amazon went through the biggest downsizing in absolute terms with 27.0K people being laid off).
If we exclude outliers (Twitter/Meta and Cisco) most of the cuts were within 1.5% to 10% range (relative to company size). Which I interpret as companies “shedding weight”.
Outliers - strategic shifts or grim realities
Twitter (49.3%) and Meta (29.3%) went through tectonic strategic shifts (in one case it’s Elon Musk’s takeover, in another it’s a change of focus to VR amidst the declining revenues). Cisco is experiencing a multi-year decline due to shrinking demand and disruptions from the competition with a generally grim outlook on the future.
Who’s getting cut?
Who’s in the highest risk zone? Let’s try to dig into the numbers to see whether there are any patterns among function or seniority roles. In order to do it, I’ve aggregated a sample of 3218 laid-off positions based on publicly accessible data.